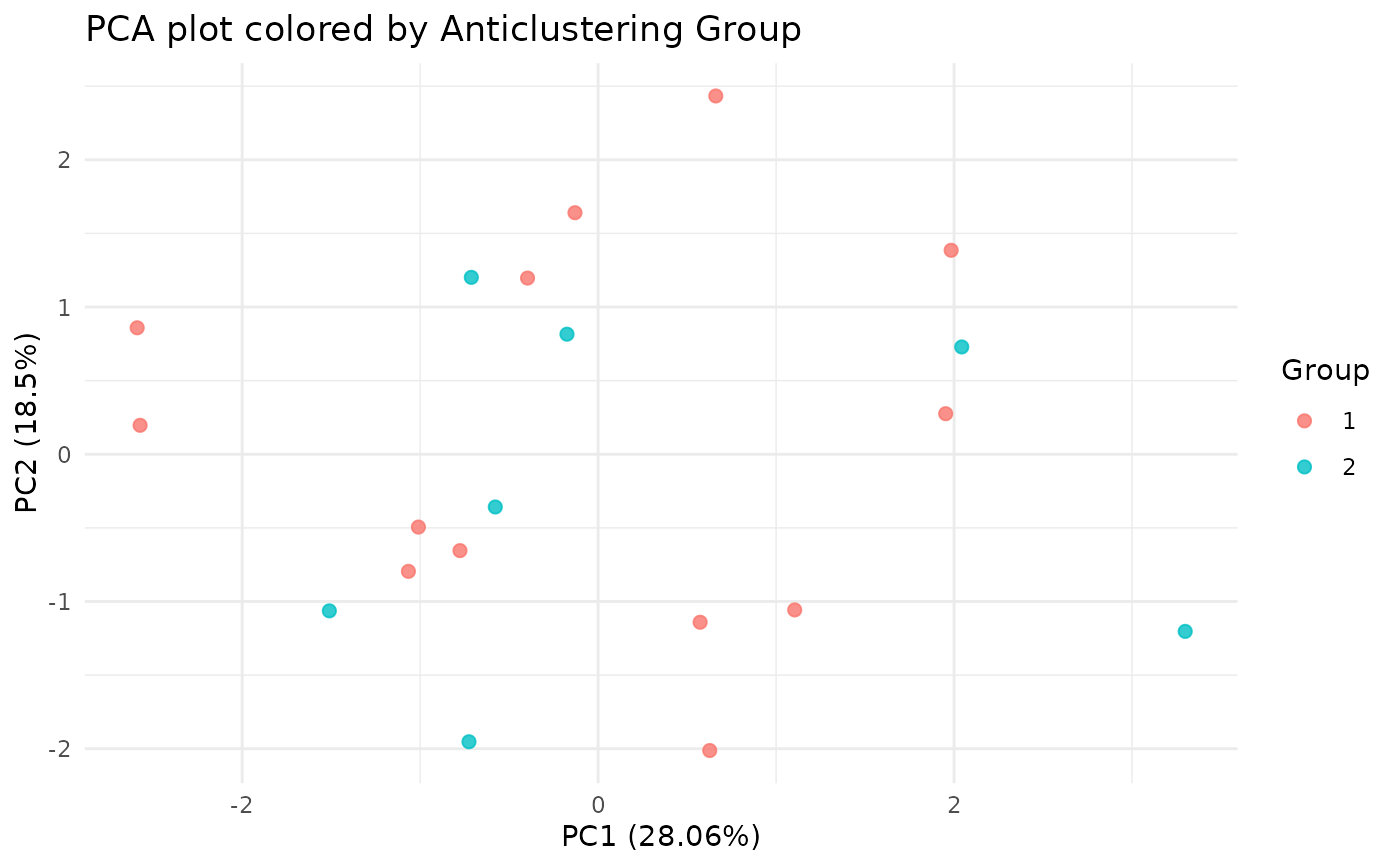
Plot PCA groups from anticlustering result
plotPCAgroups(pca_res, groups, pcs = c(1, 2), filename = NULL)Arguments
Value
A ggplot object (also prints to screen).
Plot PCA groups from anticlustering result
plotPCAgroups(pca_res, groups, pcs = c(1, 2), filename = NULL)A ggplot object (also prints to screen).